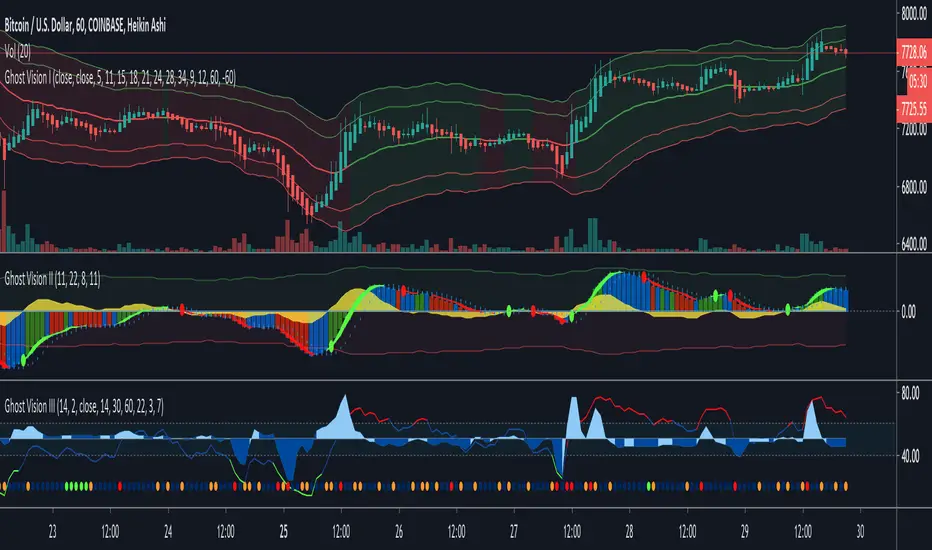
Ghost Vision IIPrice action zone — above(green) and below(red) the line is an indication of where the price action is currently at you can also identify the current direction and strength by using the mountains.
Column colors provide feedback with three colors blue, green and red. They have an important function in which they tell you what you shouldn’t be doing against momentum and strength.
GhostVision II — Will answer you for the following questions:
Should you be looking for long or short opportunities?
What is the direction of the current trend?
How strong is the direction of the current trend?
The current trend in a divergence?
Did the trend direction change or about to?
I’m allowed to go short or long now or wait?
Search in scripts for "price action"
Price Action + Support/Resistance with LabelsEntry Conditions:
Long Entry (BUY): Based on the bullish engulfing pattern and price being above the resistance level.
Short Entry (SELL): For demonstration, the short entry condition is set as price being below the support level and a bullish candle in the previous bar. You can modify this logic for your own use case.
Stop Loss and Take Profit:
Stoploss is plotted at the calculated stop loss level.
Target is plotted at the calculated take profit level.
Labels:
For long trades, labels are added with "BUY", "STOPLOSS", and "TARGET".
For short trades (if enabled), labels are added with "SELL", "STOPLOSS", and "TARGET".
Labels are placed using label.new at specific locations on the chart (above or below bars).
Alert Conditions:
Alerts are created for both long and short entry signals so you can get notified when the entry conditions are met.
How it works:
BUY label will appear below the bar when a long entry condition is met.
SELL label will appear above the bar when a short entry condition is met.
STOPLOSS and TARGET labels will appear at their respective levels when an entry signal is triggered.
The labels will appear on the chart to give you a clear visual cue of the entry, stop loss, and take profit levels.
How to Use:
Copy the script into your Pine Editor on TradingView and apply it to your chart.
Observe the labels that show up on the chart:
"BUY" will appear below the bar when long conditions are met.
"SELL" will appear above the bar when short conditions are met (if using short logic).
"STOPLOSS" will be plotted at the stop loss level.
"TARGET" will be plotted at the take profit level.
Optional Customization:
You can modify the short entry condition based on your preferred method.
You can adjust the length for the support/resistance calculation, the stopLossRR, and other parameters to fine-tune the strategy for Nifty 50 or any other asset.
Let me know if you have any further questions or need additional modifications!

Price ActionThis Pine Script code creates an indicator that plots price channels for volatility analysis:
The main parameter is the period length (default is 30), used to calculate volatility with ATR (Average True Range). Data retrieval: The indicator takes the closing price and uses it for calculations. Channel calculation: Based on volatility, three levels of channels are created: the first is the base channel, while the second and third are expanded by 8% and 16%.
First-level channels: The upper and lower boundaries of the channel are calculated based on volatility. This uses the previous bar's closing price, adjusted by a volatility coefficient.
Second and third-level channels: These channels expand by 8% and 16%, respectively, from the base channel. This creates zones that can indicate increasing or decreasing market volatility.
Each channel uses different colors and transparency levels:
The upper and lower boundaries of the first channel have solid colors.
The second channel boundaries are more transparent to denote extended levels.
The third channel boundaries are also transparent, indicating the widest range of deviation.
Visualization: Channels are displayed with different colors and transparency levels to illustrate price ranges and volatility changes.
Purpose: The indicator helps traders visualize price ranges and assess market volatility, which is useful for making trading decisions.
Practical application: This indicator assists traders in evaluating market volatility and building trading strategies based on price ranges. The extended channels can be used to identify potential reversal or trend continuation zones.

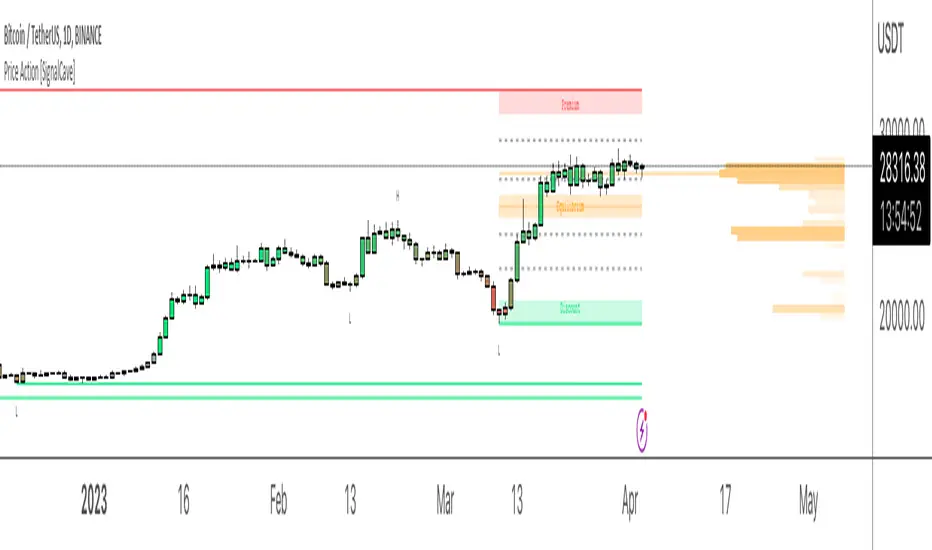
Price Action [SignalCave]Liquidation prices are calculated with Higher Timeframe usage of "Williams Fractals" indicator.
Sell side liquidity levels are shown with "L" text and a green solid lines.
Buy side liquidity levels are shown with "H" text and a red solid lines.
Premium and Discount zones are determined with latest untested buy/sell liquidity levels.
"Premium" means the asset price is overvalued, "Discount" means the asset is undervalued.
Once price hits any active liquidity level, "Premium and Discount" zone will be recalculated.
Premium and Discount have "Equilibrium" area which is center area of the whole zone.
Extra Support & Resistance levels calculation are based on Fibonacci. Levels are 23.6%, 38.2%, 61.8% and 78.6% .
Bars are painted based on asset's momentum. The asset momentum is calculated by the RSI and ADX indicators.
Volume profile shows trade activity during the "Premium and Discount" zone.
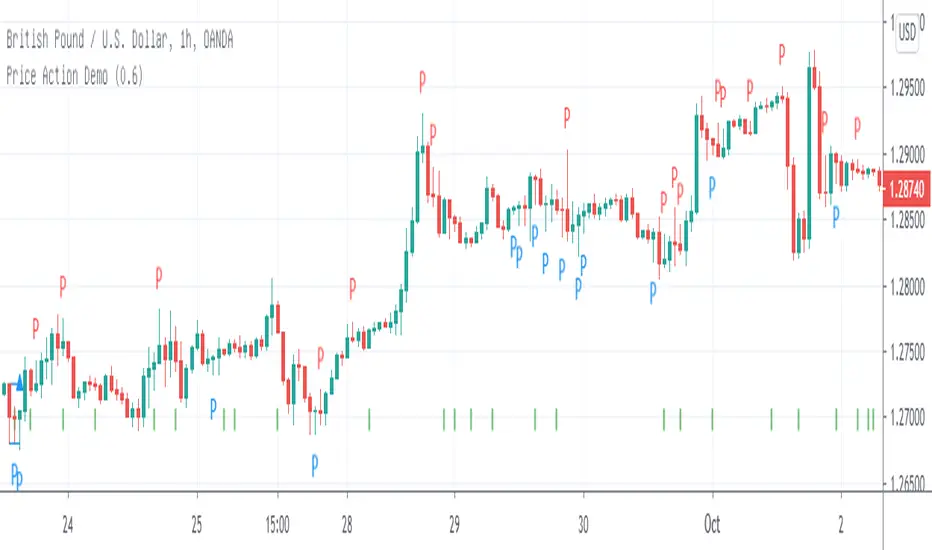
Price Action Movements by RPThis is the Indicator which will enhance finding Buying and Selling opportunity on any market.
Mostly suited for day Trading and some indicator can be used for signalling stock on longer time frame.
Indicators used to create this strategy is as follows:
- Exponential Moving Average (EMA)
- Supertrend
- Volume Weighted Average Price (VWAP)
- Exponential Moving Average of Volume Weighted Average Price (MVWAP)
- Previous Day Volume Weighted Average Price (PVWAP)
- Previous Day High, Low and Close (PDH, PDL, PDC)
- And Current Day Support and Resistance points based on Previous day Price Movement.
This will indicate where to buy and Sell with Indicator based on Following criteria,
Buy Signal given,
- When Close is above Exponential Moving Average 9
- When Close is above Exponential Moving Average 21
- RSI above 55
- Supertrend is positive
- Volume is above 300 moving Average
- Close is above Volume Weighted Average Price
Sell Signal given,
- When Close is below Exponential Moving Average 9
- When Close is below Exponential Moving Average 21
- RSI below 45
- Supertrend is negative
- Volume is above 300 moving Average
- Close is below Volume Weighted Average Price
Trades can use this Study according to their need of the Indicator.
Users can Tick the indicator which they want to add on Charts to study.
Only Exponential Moving Average indicator can be used.
Only Supertrend can be used.
Volume Weighted Average Price, Previous Day Volume Weighted Average Price, Exponential Moving Average of Volume Weighted Average Price and Previous Day High, Low and Close can be used as a particular study.
Support and Resistance can be used along with Previous Day High and Previous Day Low as a particular study.
This is multipurpose Study which will help Trading Society immensely.
Thank You.

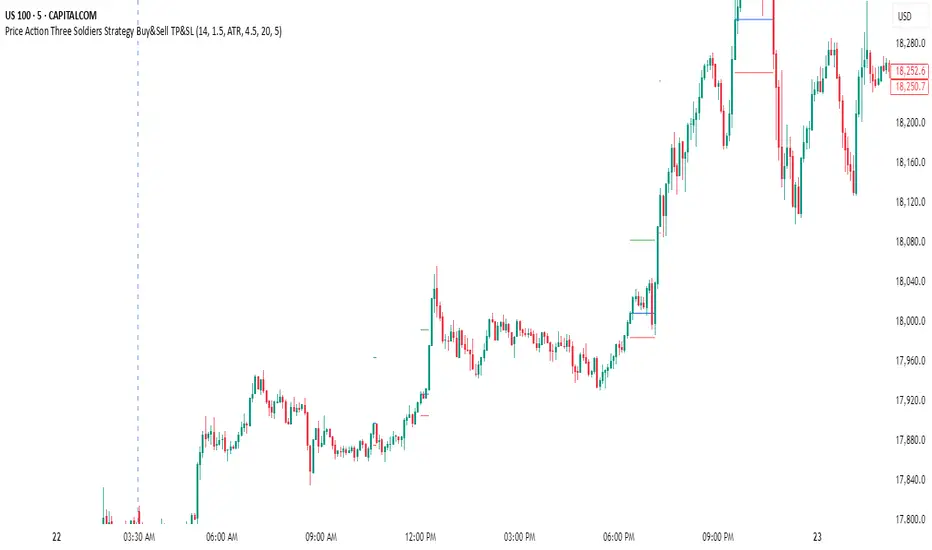
Price Action Three Soldiers Strategy Buy&Sell TP&SLStrategy Overview:
This indicator detects a "Three White Soldiers" bullish pattern to suggest potential buy opportunities. It uses dynamic Stop Loss (SL) and Take Profit (TP) management, based on either market volatility (ATR) or liquidity zones.
This tool is intended for educational and informational purposes only.
📈 Key Features:
Entry: Based on detecting Three White Soldiers candle pattern.
Exit: Targets are managed through ATR multiples or previous liquidity levels (swing highs).
Smart Liquidity: Optionally identify deeper liquidity targets.
Full Alerts: Buy and Sell signals supported with customizable alerts.
Visualized Trades: Entry, SL, and TP levels are plotted on the chart.
⚙️ User Inputs:
ATR Length, ATR Multipliers
Take Profit Mode (Liquidity/ATR)
Swing Lookback and Strength
Toggleable Buy/Sell alerts
📖 How to Use:
Add the Indicator:
Apply the script to your chart from the TradingView indicators panel.
Look for Buy Signals:
A buy signal is triggered when the script detects a "Three White Soldiers" bullish pattern.
Entry, Stop Loss, and Take Profit levels are plotted automatically.
Choose Take Profit Mode:
ATR Mode: TP is based on a volatility target.
Liquidity Mode: TP is based on past swing highs.
Set Alerts (Optional):
Enable Buy/Sell alerts in the settings to receive real-time notifications.
Practice First:
Always backtest and paper trade before live use.
📜 Disclaimer:
This script does not offer financial advice.
No guarantees of profit or performance are made.
Use in demo accounts or backtesting first.
Always practice proper risk management and seek advice from licensed professionals if needed.
✅ Script Compliance:
This script is designed in full accordance with TradingView’s House Rules for educational tools.
No financial advice is provided, no performance is guaranteed, and users are encouraged to backtest thoroughly.
Price Action (ValueRay)With this indicator, you gain access to up to 5 moving averages from a selection of 15 different types. This flexibility allows you to customize your trading strategy based on your preferences and market conditions. Whether you're a fan of simple moving averages, exponential moving averages, or weighted moving averages, our indicator has got you covered! Additionally, all the MAs are Multi-Time-Frame!
The indicator also provides trading signals. By analyzing market trends and price movements, it generates accurate buy and sell signals, providing you with clear entry and exit points. You can choose between Fast, Mid, and Slow signal speeds.
Trendlines are another crucial aspect of effective trading, and our indicator seamlessly integrates them, helping you visualize the market's direction.
Furthermore, the indicator empowers you with recent highs and lows. By highlighting these key levels, it becomes easier than ever to spot support and resistance areas, aiding you in making well-informed trading choices.
Additionally, you can switch the ADR% (Average Daily Range as a Percentage) on and off. This number instantly provides you with information on how much the stock usually moves per day as a percentage.
Key Features:
Up to 5 Moving Averages, each with its own timeframe.
SMA, EMA, WMA, RMA, Triangular, Volume Weighted, Elastic Volume Weighted, Least Squares, ZLEMA, Hull, Double EMA, Triple EMA, T3, ALMA, KAMA (more to come in future versions).
Recent High and Low Pivot Points acting as support/resistance.
Trendline indicating the current trend.
Buy/Sell Signals (recommended for use as exit points, stop loss, or take profit levels).
Signals can have three different speeds: Fast, Mid, and Slow. You can switch them anytime depending on how quickly or slowly you want to exit a trade.
The predefined colors are best suited for a dark background, and the predefined settings provide a solid starting point that many traders use in their daily work.
Unlock the full potential of your trading strategy with our comprehensive indicator and start making informed trading decisions today!

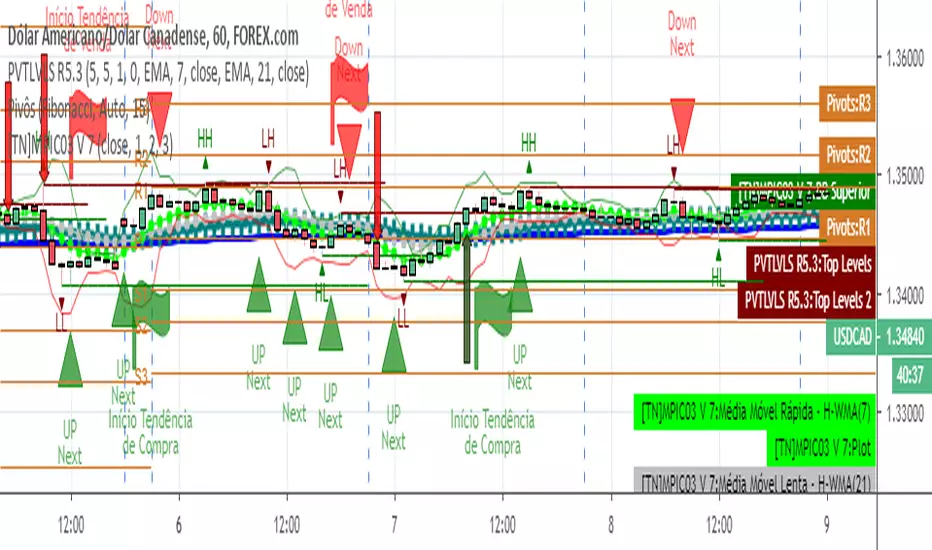
NRAA v2.00 price action strategy.
green dot comes when high is greater than previous two high and same thing with rsi .
red dot comes when low is less than previous two low and same thing with rsi .

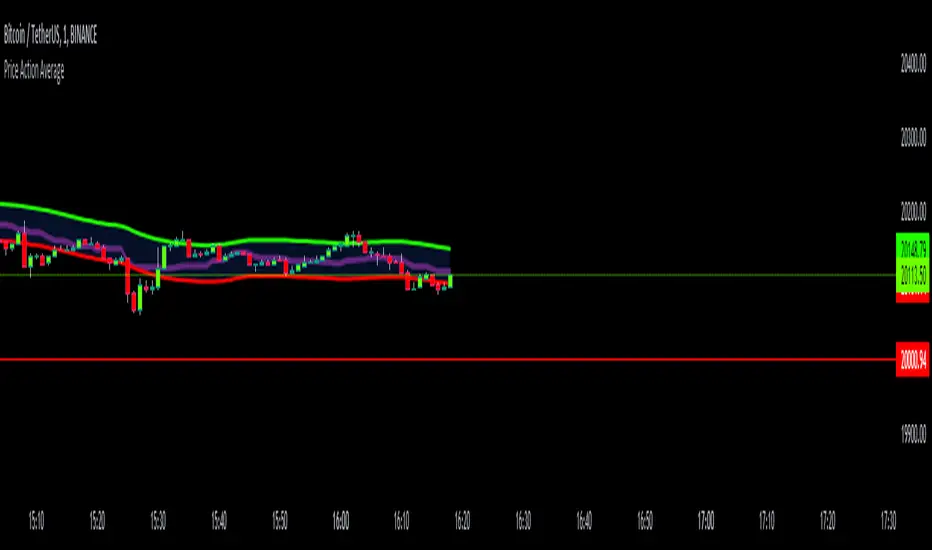
Price Action AverageThis indicator is perfect for scalping in 1 minute, it consists of a channel and a line that is made up of the average of the highs and lows of the price in 12 and 64 cycles.
The channel has as its center a 7 cycles SMA, when the average line (Called Signal, the purple one) crosses the upper band it is time to make a Long.
If it crosses the lower band it is time to make a short, if the line returns to the channel a signal appears to close the operation.
The indicator works with all timeframes, I use it on the 1 hour chart and I do the trades in 1 minute.
Price-Action-BarsThis script came as a discussion in our community forum.
It paints
1. Pin Bars (Bottom or Top)
2. inside/outside Bar
3. Bullish Bottom bar
It also has the ability to add alerts on your favorite stocks

Price action level indicatorFinds levels based on pressure candles and combines that with trend analysis. Best used on the hourly on futures.

Price Action Points
Central Pivot Range(CPR) are most important pivots points while day trading.
Clean and neat CPR indicator with price on lines. Also tomorrow pivots are added too
They are the most powerful and acts as support/resistance.
Use with Moving Averages(20,50):
20EMA for taking the entry which strong momentum is confirmed.

2HH2LL formationPrice action formation like a confirmation to get in to the trade. Based on 3 candles.
2HH formation= High-> higher high-> open above and close below high of the first bar.
2LL formation= Low-> lower low-> open and close above low of the first bar.

DPMPrice action based volatility. Used to determine profitable intraday trading periods. Lower values indicate unprofitable periods, high values indicate more profitable periods. To be used on XBTUSD 1 day chart.

PAVTI OverlayPrice Action Volume Trend Analysis
Used to confirm bias on trend. Use with caution, use conventional TA to find entries once bias is confirmed.
Green arrows are indication of an up-trend forming.
Red arrows are indication of a down-trend forming.


Price Action Oscillator [NeoButane]An oscillator based on pivots and divergences in the future, with an emphasis on utilizing wicks to find the 'best fit' horizontal levels.
This is a study I am working on to find to find divergences and swings better, and how using an oscillator can enhance the pickings of swings and levels.
A list of my indicators: medium.com

Price Action Channel Master by JustUncleLThis indicator combines a number of PAC types into one indicator and will replace some of my previously PAC scripts (some were not published).
It draws a Moving Average (MA) channel based on various boundary criteria. Even though the MA choices are not limited to SMA and EMA, these would be the your first choices with most PAC requirements, feel free to experiment though.
Optional Bar colouring around that channel.
Options Available:
(1) Select between 11 different types of moving averages for the base (centre) MA line choices are :
SMA = Simple Moving Average (default)
EMA = Exponential Moving Average.
WMA = Weighted Moving Average
VWMA = Volume Weighted Moving Average
SMMA = Smoothed Simple Moving Average.
DEMA = Double Exponential Moving Average
TEMA = Triple Exponential Moving Average.
HullMA = Hull Moving Average
SSMA = Ehlers Super Smoother Moving average
ZEMA = Near Zero Lag Exponential Moving Average.
TMA = Triangular (smoothed) Simple Moving Average.
(2) Select Channel Boundary Criteria:
HILO = Channel boundaries based on High and Low MAs (default).
ATR = Channel boundaries are Multiplier * ATR distance from base line
PIP = Channel boundaries are Multiplier * PIPs distance from base line
STDEV = Channel boundaries are Multiplier * StdDev(price) distance from base line (this is the same as Bollinger bands if SMA is the base MA)
KC = Channel boundaries are Multiplier * StdDev(True Range) distance from base line (this is the same as Keltner channel if SMA is the base MA)
(3) Option to display coloured Candles around the Ribbon, the colouring uses the Default candle 3-tone colour scheme:
Lime = candle closed above Ribbon.
Red = candle closed below Ribbon.
Gray = Candle Closed inside Ribbon.
The Grab candles 6-tone colour scheme:
Lime = Bull candle closed above Ribbon.
Green = Bear candle closed above Ribbon.
Red = Bull candle closed below Ribbon.
DarkRed = Bear candle closed below Ribbon.
Aqua = Bull candle closed inside Ribbon.
Blue = Bear candle closed inside Ribbon.

Price-Actionclassic patterns.
daily charts.
CPR-
Green+level=buy
red+level=sell
pinbar
green pinbar+level=buy
red pinbar+level=sell
green ppr+level=buy
ppr-
red ppr+level=sell
IB- and OB-
green IB/OB+level=buy
red IB/OB+level=sell
third bar
green third bar+green cpr+level=buy
red third bar+redcpr+level=sell
3 candles green = buy, tp30 pips(gbpusd,gbpjpy)
3 candles red = sell, tp30 pips. (gbpusd,gbpjpy)

Price Action Doji Harami v0.2 by JustUncleLThis is an updated and final version of this indicator. This version distinguishes between the true Harami and the other Doji candlestick patterns as used with the Heikin Ashi candle charts. These candle patterns indicate a potential trend reversal or pullback.
The patterns identified are:
- Bearish Harami (Red Highlight above Bar):
One to three (default 3) large body Bull (green) candles followed by a small (red)
or no body candle (less than 0.5pip) with wicks top and bottom that are at least 60% of candle.
- Bullish Harami (Green Highlight below Bar):
One to three (default 3) large body Bear (red) candles followed by a small (green)
or no body candle (less than 0.5pip) with wicks top and bottom that are at least 60% of candle.
- Bearish Doji (Fuchsia Highlight above Bar):
One to three (default 3) large body Bull (green) candles followed by a small (green)
with wicks top and bottom that are at least 60% of candle.
- Bullish Doji (Aqua Highlight below Bar):
One to three (default 3) large body Bear (red) candles followed by a small (red)
with wicks top and bottom that are at least 60% of candle.
You can optionally specify how large the candles prior to Harami/Doji are in pips, default is 0 pip.
If you set this to zero then it will have no candle size consideration. You can also specify how many look back candles (1-3) are used in Harami/Doji calculations (default 3).
Included option to perform Calculations purely on Heikin Ashi candles, this helps when you want to see the HA Doji/Harami bars with the normal candle stick chart.
Also can optionally set an alert condition for when Harami/Doji found, this also displays a circle on the bottom of the screen when alert is triggered.
